With Americans preparing to vote in the November midterm elections, Donald Trump’s approval ratings are under intense scrutiny. Fish 4 News examines polling from across the political spectrum, including Fox News, Rasmussen, Reuters, Pew Research and more, to establish what Americans actually think of their president.
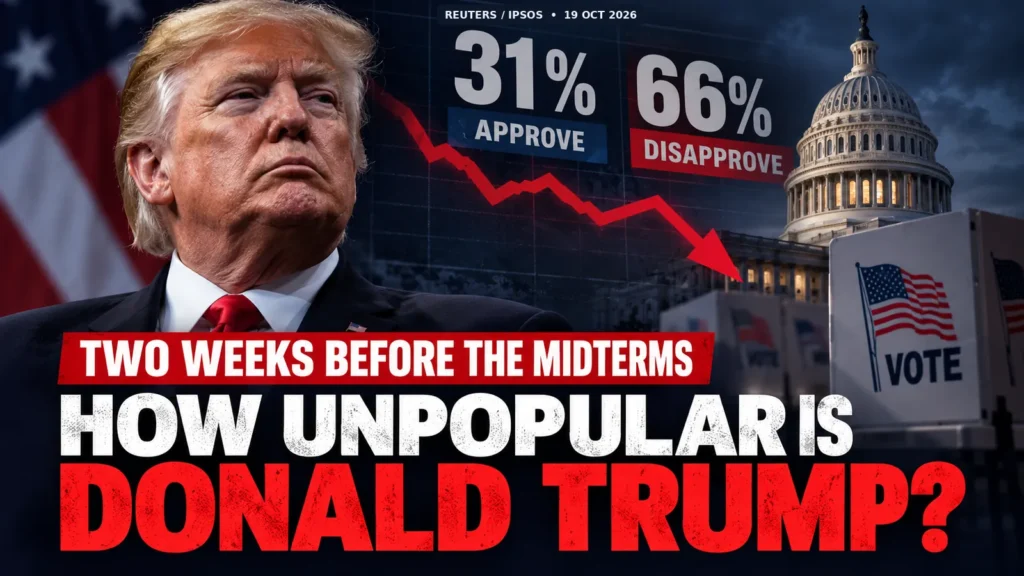
With two weeks until the United States midterm elections on 3 November 2026, President Donald Trump is facing widespread public disapproval. A Reuters/Ipsos survey published on 19 October puts his job approval at just 31%, with 66% disapproving. Fox News has recorded 36% approval, while even pollsters reporting comparatively higher figures, including Rasmussen and RMG Research, find that more Americans disapprove of his performance than approve.
There is an obvious question whenever a politically sensitive opinion poll appears: who conducted it?
A CNN survey showing disappointing numbers for Trump might be dismissed by his supporters. The same might happen with NBC, ABC or another organisation perceived as hostile to the president.
But what happens when Fox News, Rasmussen Reports, Reuters, Pew Research and numerous independent polling organisations are all reporting the same broad picture?
That is the question Fish 4 News set out to examine.
Rather than selecting a particularly damaging survey or relying on an individual news network, we have compared a wide range of published presidential job approval figures, alongside changes recorded during the past three to four months.
The findings require some important qualifications. Not every polling organisation reports identical figures, not every survey has deteriorated at the same rate and national approval ratings do not directly predict congressional election results.
Nevertheless, the consistency of negative approval ratings across the surveyed organisations is difficult to overlook.
The latest polls: who approves and who disapproves?
The following table brings together the latest identified national job approval readings from a broad range of polling organisations and media-sponsored surveys.
| Pollster or survey | Fieldwork end | Approve | Disapprove |
|---|---|---|---|
| Reuters/Ipsos | 19 Oct | 31% | 66% |
| Morning Consult | 19 Oct | 41.5% | 56.4% |
| Rasmussen Reports | 18 Oct | 43% | 55% |
| ABC/Washington Post/Ipsos | 13 Oct | 33% | 66% |
| RMG Research | 13 Oct | 41% | 58% |
| Fox News | 12 Oct | 36% | 64% |
| AP-NORC | 12 Oct | 36% | 64% |
| NBC News/SurveyMonkey | 12 Oct | 34% | 66% |
| Economist/YouGov | 12 Oct | 34% | 62% |
| NewsNation | 9 Oct | 38% | 60% |
| Noble Predictive Insights | 7 Oct | 43% | 55% |
| The Honest Poll | 6 Oct | 42% | 57% |
| The Bullfinch Group | 6 Oct | 41% | 57% |
| Financial Times/Focaldata | 5 Oct | 33% | 58% |
| Pew Research Center | 4 Oct | 30% | 68% |
| CBS News/YouGov | 2 Oct | 39% | 61% |
| I&I/TIPP | 1 Oct | 39% | 52% |
| Harvard CAPS/Harris | 28 Sep | 42% | 55% |
| Quinnipiac University | 27 Sep | 34% | 61% |
| Emerson College | 22 Sep | 39% | 58% |
| American Research Group | 20 Sep | 30% | 68% |
| CNN/SSRS | 17 Sep | 33% | 67% |
| John Zogby Strategies | 17 Sep | 42% | 56% |
| New York Times/Siena | 13 Sep | 38% | 59% |
| Marquette University, national | 9 Sep | 37% | 63% |
Methodology: Figures represent reported presidential job approval, not personal favourability or election voting intention. They include surveys of all adults, adult citizens, registered voters and likely voters. Percentages are rounded where appropriate and may not total 100% because of undecided respondents. These are selected national surveys, generally the most recent identified from each organisation, rather than every poll conducted in the period. AP-NORC and ABC/Washington Post figures use specified sample populations that can produce different results from those displayed by individual aggregators.
Readers can inspect the full poll listings and further methodology at RealClearPolling and the historical polling database at PollResults.org.
For example, the October Reuters/Ipsos survey put Trump’s approval at 31% among all adults but at 34% among registered voters. Polling aggregators sometimes display the registered-voter figure for the same survey. These figures should not be mistaken for conflicting results or a three-point movement over time.
The table also includes organisations whose results are frequently discussed by conservative audiences, rather than restricting the comparison to traditional national television networks.
Newsmax is not counted as an additional independent polling organisation merely for reporting another company’s survey. To count twice would exaggerate the evidence.
Fox News records Trump’s lowest approval rating
Of particular interest is the Fox News survey published on 14 October.
It reported that only 36% of registered voters approved of Trump’s overall job performance, while 64% disapproved.
According to Fox News, that represents Trump’s lowest overall approval rating in any of its surveys across both presidential terms.
His approval had previously remained at approximately 39% since May.
The poll was carried out between 9 and 12 October among 1,202 registered voters, with Beacon Research and Shaw & Company Research responsible for the fieldwork.
The implications extend beyond the headline number.
Fox found just 22% approved of Trump’s handling of inflation, while 77% disapproved. His handling of the economy, tariffs and foreign policy also received majority disapproval.
Border security was an exception, producing an even 50%-50% split.
Support within his own party remained considerably stronger, although overall approval among Republicans had fallen to 76% in the Fox survey.
This is not a finding attributed to Fox News by one of its political opponents. It is the network’s own published polling.
Reuters and Pew put approval even lower
The Reuters/Ipsos poll released on 19 October provides the latest major reading.
Conducted between 16 and 19 October, it surveyed 1,679 American adults using Ipsos’s probability-based KnowledgePanel.
Its overall figures were:
- 31% approve of Trump’s performance.
- 66% disapprove.
- Approximately 3% either did not answer or were otherwise unaccounted for after rounding.
Reuters described the approval figure as the lowest recorded by its polling across Trump’s two presidencies.
A separate Pew Research Center study released on 8 October found 30% approval and 68% disapproval.
Pew surveyed 5,062 adults between 28 September and 4 October, making it one of the larger surveys in this comparison.
There was another finding worth examining.
Among Americans who voted for Trump in the 2024 presidential election, Pew found that 67% now approved of his performance. That was down from 75% in July and 95% early in his second term.
That does not mean all those former supporters would necessarily vote against a Republican candidate in November. Approval of a president and congressional voting intentions are different questions.
It does, however, demonstrate that declining satisfaction is not confined to voters who opposed Trump in the first place.
Has Trump’s approval actually fallen since July?
A single poll provides a snapshot.
Repeated surveys from the same organisation provide a better indication of whether public opinion has changed.
The following comparison looks at selected readings from July, August, September and October.
| Polling series | July | August | September | October |
|---|---|---|---|---|
| Fox News | 39% | — | 39% | 36% |
| Pew Research | 34% | — | — | 30% |
| Marquette, national | 40% | — | 37% | — |
| ABC/Washington Post/Ipsos trend | 37% | — | — | 33% |
| RMG Research / Napolitan News | 44% | 44% | — | 41% |
| Reuters/Ipsos | — | 33% | 32% | 31% |
| Economist/YouGov | 34% | 33% | — | 34% |
| Rasmussen Reports | 44% | — | — | 43% |
| I&I/TIPP | — | — | 38% | 39% |
Selected published observations within each series, not monthly averages. Dashes indicate that a directly comparable observation has not been included. The July and August RMG figures are full-month results from Napolitan News; the October result is a shorter rolling registered-voter survey and is not strictly comparable. The Reuters and other figures are selected readings, not monthly averages, and should be compared only within their respective series.
The pattern is not an uninterrupted decline in every survey.
Economist/YouGov measured 34% approval in late July, 33% in August and 34% again in October. I&I/TIPP rose from 38% in September to 39% in October, a change too small to establish a meaningful improvement on its own.
RMG Research, which conducts surveys for Napolitan News Service, reported 44% monthly approval in both July and August. Its shorter rolling registered-voter survey ending on 13 October reported 41% approval. These different reporting periods should not be presented as one uninterrupted trend.
Fox, Pew and Marquette also recorded lower approval in their more recent surveys than in July.
The strongest defensible conclusion is therefore that Trump’s approval was already low during the summer, with several independent series recording further deterioration as the midterm elections approached.
Not every individual movement is statistically significant, but the wider pattern matters.
What do the polling averages show?
Individual surveys can differ because they interview different populations, use different methods and ask questions in different ways.
Polling averages seek to reduce the influence of individual fluctuations.
As of the latest published figures examined for this article:
| Polling average | Approve | Disapprove |
|---|---|---|
| RealClearPolling, checked 20 Oct | 38.9% | 60.0% |
| The Hill/Decision Desk HQ, checked 20 Oct | 38.6% | 59.8% |
Both aggregates place Trump’s approval below 40%, with disapproval close to 60%.
The methodologies differ, and neither should be presented as an exact measure of every American’s opinion.
But the averages provide another way to examine the evidence without depending on any one poll.
Why are Americans dissatisfied?
The economy is a recurring concern across the surveys.
In the October Fox News poll, 60% of registered voters identified the cost of living as their greatest economic worry.
In the October ABC/Washington Post/Ipsos poll, only 21% of adults approved of Trump’s handling of the cost of living, compared with 77% who disapproved.
On inflation, that same survey recorded 23% approval and 75% disapproval.
The situation involving Iran also features prominently.
Marquette University’s September national survey found 26% approved of Trump’s handling of the war with Iran, while approval of his approach to petrol prices stood at just 20%.
These questions measure attitudes towards particular policies, not necessarily the precise causes of any change in overall presidential approval.
Nevertheless, they identify areas where respondents are expressing substantial dissatisfaction.
It is also important to acknowledge that Trump’s ratings are not equally low on every issue.
Border security and immigration continue to receive comparatively stronger approval in several polls. Different demographic and political groups also hold markedly different views of his presidency.
What about the argument that the polls are fake?
Trump himself has challenged unfavourable polling.
At an Ohio rally on 3 October, he referred to polls as fake and argued that they had failed to account for the impact of his personal campaigning, according to Fox News’s reporting of his remarks.
Questioning polling is legitimate. Surveys are estimates rather than election results, and their assumptions, sampling techniques and weighting deserve scrutiny.
A particular survey may be wrong. Even several surveys may share systematic errors.
But explaining away the findings becomes more complicated when different organisations, using different samples and methodologies, repeatedly identify the same broad balance of public opinion.
That does not prove every number is correct.
It does mean that criticism should address the research methods and evidence, rather than simply the identity of whichever news organisation reports an unfavourable result.
Does disapproval mean the Republicans will lose?
Not necessarily.
Presidential approval measures public satisfaction with the incumbent president. Congressional elections determine who represents individual states and districts.
Those are related but distinct questions.
The latest Reuters/Ipsos survey found 47% of registered voters preferred Democratic congressional candidates, compared with 35% choosing Republicans.
Fox News separately found Democratic candidates ahead by 54% to 45% in its generic House ballot.
Neither survey represents the result in every congressional district. Local candidates, district boundaries, campaign spending, turnout and late changes in opinion can all affect the eventual outcome.
Moreover, voters may disapprove of the president yet still prefer a Republican representative, or disapprove of both major parties.
The approval figures are therefore significant political context, not a forecast of the final seat count.
The bigger picture
By the final fortnight before the 2026 midterms, the central polling question is no longer confined to whether one news organisation has published a particularly unfavourable survey.
Fox News, Reuters/Ipsos, Pew Research, Rasmussen, RMG Research, YouGov and numerous other polling organisations have reported national approval figures below their corresponding disapproval figures.
Some show a pronounced decline since July. Others suggest a more stable period of negative public opinion.
The exact level of approval remains uncertain, and the outcome of the congressional elections is still to be decided by voters.
But the available polling evidence establishes a consistent finding across an unusually broad range of sources: more respondents disapprove of Trump’s performance as president than approve.
On 3 November, Americans will vote for their representatives in Congress.
The polling tells us how those surveyed currently view the president. The election will reveal how those views, alongside many other considerations, translate into actual votes.
Sources and methodology
- Reuters/Ipsos, 19 October 2026
- Fox News Poll, 14 October 2026
- Pew Research Center, 8 October 2026
- ABC News/Washington Post/Ipsos, October 2026
- Marquette Law School, September 2026
- AP-NORC, October 2026
- Quinnipiac University, September 2026
- Emerson College Polling, September 2026
- I&I/TIPP, October 2026
- Rasmussen Reports presidential tracking, 19 October 2026
- RMG Research / Napolitan News October 2026 poll (topline PDF)
- Napolitan News monthly approval, July 2026
- Napolitan News monthly approval, August 2026
- RealClearPolling presidential approval tracker
- The Hill/Decision Desk HQ polling average
- National historical polling database
Individual poll fieldwork cut-off: 19 October 2026. Polling averages checked on 20 October 2026. Figures are subject to subsequent releases and revisions.